How We Got the Map Data
This page offers an overview of the Map the Meal Gap methodology and links to technical briefs that provide greater detail about the methods and data
Published
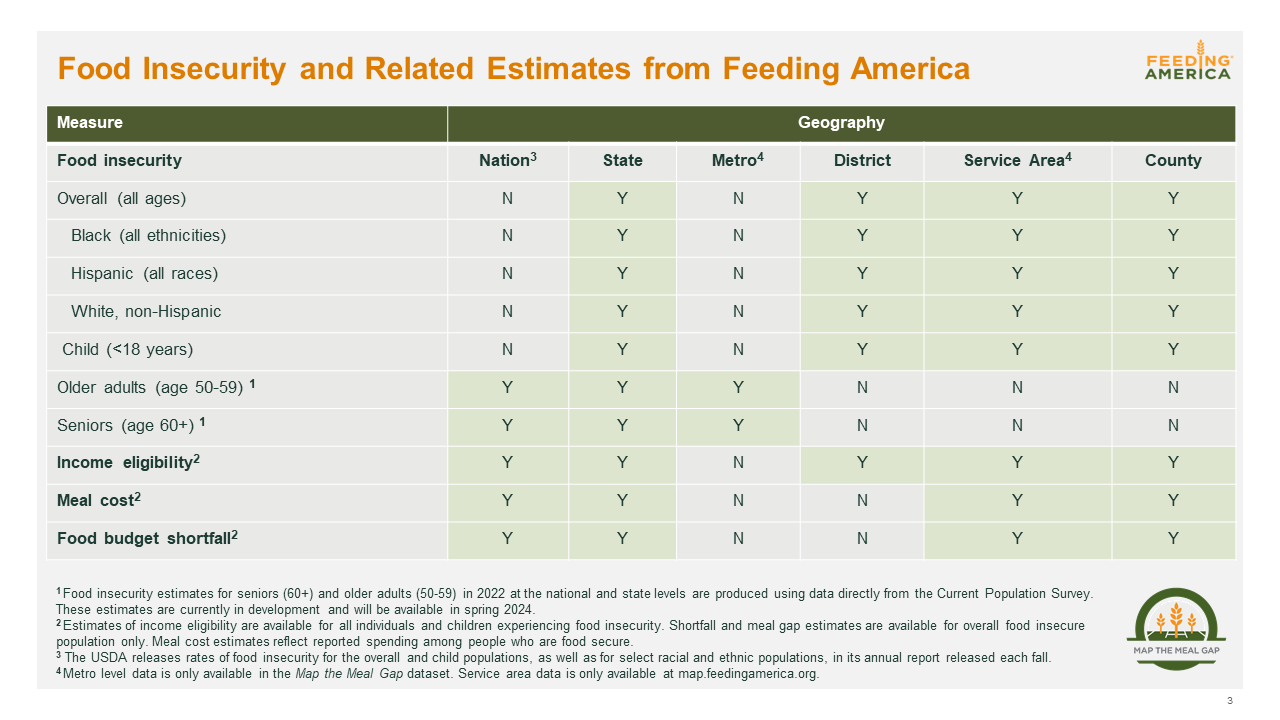
Map the Meal Gap generates the following estimates:
- Local food insecurity for overall population, children, older adults, seniors, select income levels, and select races/ethnicities
- Local federal program eligibility among the overall population and children experiencing food insecurity
- Additional dollars needed among people estimated to be food insecure (a.k.a., food budget shortfall)
- Food spending by people who are food secure (a.k.a., average meal cost)
This page offers an overview of the Map the Meal Gap methodology and links to technical briefs that provide greater detail about the methods and data. Read the most recent technical brief for the latest Map the Meal Gap study released in 2025 and reflecting 2023 data and an overview of the available data part of the study.
Study Methodology
Food insecurity rates and numbers*

The relationship between food insecurity and its closely linked indicators (poverty, unemployment, homeownership, disability prevalence, etc.) are first analyzed at the state level. Then, the coefficient estimates from this analysis are used with the same variables for every county and congressional district with available estimates. Together, these variables can generate estimated food insecurity rates for individuals and children at the local level.
Food budget shortfall

Responses from food insecure households to the Current Population Survey questions about a food budget shortfall are calculated at the individual level and then averaged to create a weekly food budget shortfall. This national average weekly shortfall can be annualized by multiplying the estimate by 52 (weeks per year) and again by 7/12 (the average number of months in a year that food-insecure households experience food insecurity per the U.S. Department of Agriculture).
Cost-of-food index

NielsenIQ assigns every sale of UPC-coded food items in a county to one of the food categories in the USDA Thrifty Food Plan (TFP) and then weights those categories based on actual pounds purchased per week. We then apply county and sales tax rates to the NielsenIQ market basket prices to create a relative price index that, when applied to the national average meal cost and national food budget shortfall, reveals differences in the cost of food at the local level.
National average meal cost

The average dollar amount spent on food per week by food-secure individuals is divided by 21 (assuming 3 meals per day and 7 days per week). Reported food expenditures by food-secure individuals are used to ensure that the result best reflects the cost of an adequate diet. We then adjust the national average cost per meal by a relative food cost index to derive a local estimate.
Annual Technical Briefs
Since 2013, Feeding America has released an annual Map the Meal Gap report that featured data on both child and overall food insecurity.
- 2024 Technical Brief (2022 data)
- 2023 Technical Brief (2021 data)
- 2022 Technical Brief (2020 data)
- 2021 Technical Brief (2019 data)
- 2020 Technical Brief (2018 data)
- 2019 Full Report and Technical Appendix (2017 data)
- 2018 Technical Brief (2016 data)
- 2017 Technical Brief (2015 data)
- 2016 Technical Brief (2014 data)
- 2015 Technical Brief (2013 data)
- 2014 Technical Brief (2012 data)
- 2013 Technical Brief (2011 data)
In 2011 and 2012, Feeding America released separate Map the Meal Gap reports for overall and child food insecurity.
- 2012 Overall Food Insecurity Technical Brief (2010 data)
- 2012 Child Food Insecurity Technical Brief (2010 data)
- 2011 Overall Food Insecurity Technical Brief (2009 data)
- 2011 Child Food Insecurity Technical Brief (2009 data)
*The methodologies used to estimate food insecurity for seniors and older adults differ from those used to estimate rates for other subpopulations. See the Technical Appendix for more information